Analytics — The Game Is Afoot!
“It is a capital mistake to theorize before one has data. Insensibly one begins to twist facts to suit theories, instead of theories to suit facts,” said Sherlock Holmes in Sir Conan Doyle’s A Scandal in Bohemia. Although Holmes was discussing evidentiary facts, his sentiment would fit perfectly in today’s world of analytics, a world Holmes would have been fascinated by.
Today, analytics are everywhere. It’s an indispensable tool for business. Executives use it to understand their business, acquire customers, market to customers, reduce customer churn, dynamically price tickets for planes, trains, hotel rooms, and casino table seats. Everything from customer acquisition, customer personalization, and customer churn use analytics.
Analytics allow companies to make data-driven business decisions that take into account information running through real-time systems.
Although the mathematical concepts much of today’s analytical tools utilize have been around for centuries, to realize the potential of a real-time, data-driven, analytical modeling system required a revolution in hardware, software, and networking systems that took decades to achieve — and is only now reaching fruition. Companies now benefit from a system that took centuries to perfect.
Analytics Value Escalator
A Google search of “analytics” returns billions of results, but I’ve found Gartner’s Analytics Value Escalator framework (see Figure 1) is probably one of the clearest representations of what’s going on under the analytics hood. First appearing in 2017, the framework was introduced as a model to help organizations understand and communicate the progressive stages of value derived from their data integration and analytics investments.

Figure 1: Gartner’s Analytics Value Escalator
The Analytics Value Escalator illustrates how analytics maturity evolves from descriptive (what happened?) to diagnostic (why did it happen?) to predictive (what will happen?) to prescriptive (what should happen?). The business value increases as you rise up the four analytics steps, but so too does the difficulty level. With analytics investments, optimization is the ultimate goal as that’s where the biggest ROI will come from. The Analytics Value Escalator is a part of Gartner’s broader push to frame analytics maturity in terms of business outcomes.
Real-time, data-driven analytical insights are improving corporate decision-making capabilities. With analytics, corporations can understand their business down to a widget sale level. They can identify areas to improve efficiency and reduce costs, thereby, potentially, increasing profit.
Personalization marketing, which needs strong analytics to function properly, helps raise customer satisfaction scores. Customer feedback loops, which use real-time data from social media channels, provide businesses with instant information on how to improve their products and services. Revenue management models even help airlines, casinos, amusement parks, and hospitality companies sell perishable inventory at the highest possible price.
The Four Types of Analytics
Descriptive analytics, diagnostic analytics, predictive analytics, and prescriptive analytics all have some similarities (besides having ‘analytics’ in their name), but they are all quite unique too. One type of analytics builds upon another, gaining value in the rise up the Analytics Value Escalator.
As organizations move up the escalator, the value of the analytics increases, but so does the difficulty of getting a positive ROI result. With analytics, there are no free steps.
Descriptive analytics, the lowest rung of the Escalator, it the easiest to attain but has limited value. Prescriptive analytics is the hardest to implement, but it provides the most value to an organization. Optimization is the goal for most corporations and companies who implement prescriptive analytics well can see healthy ROI returns. This is the rarified air of revenue price optimization, dynamic pricing, personalized promotions, fraud response automation, and full labor utilization models.
Descriptive Analytics — What Happened?
“Data! Data! Data! I can’t make bricks without clay,” Sherlock Holmes cried in The Adventure of the Copper Beeches. Holmes was a man who understood the need for analytics, particularly descriptive analytics, which focuses on facts and is the foundational element upon which more powerful analytics can be built.
Unlike predictive analytics or prescriptive analytics, descriptive analytics answer questions like:
• What were our sales last quarter?
• How does customer behavior vary by region?
• What are the most common reasons for customer churn?
• Who are the company’s highest spenders?
Descriptive analytics are the basis for reports and dashboards that look back and provide hindsight about a company’s data and business, like sales performance for the past quarter. Many business intelligence (BI) dashboards provide nothing more than a set of descriptive analytics that provide insightful information about company’s past behavior, often with graphs, charts, tables or maps.
Segmentation models (See Figure 1) are considered a descriptive analytics model. They help businesses track all kinds of unique features about their customers, including age, gender, demographics, location, education level, income, etc., etc., etc. These segments let businesses personalize their marketing offers, making them more enticing.
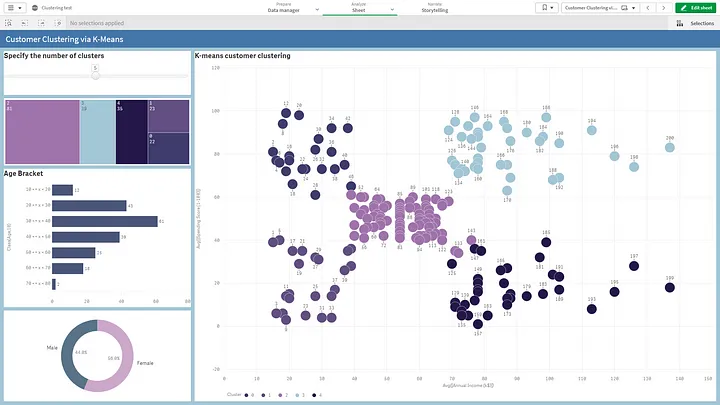
Figure 2: A business intelligence dashboard showing customer segments.
Descriptive analytics analyze historical data to identify patterns, trends, and relationships. It summarizes data, describes the main features of a dataset, identifies trends and correlations between variables over time. It includes measurements like the mean, range, standard deviation, and distribution. It provides insight into an organization’s past performances while offering context to help corporate executives and stakeholders interpret the data.
Retailers can use descriptive analytics for market basket analysis, which can reveal a customer’s shopping and purchasing behavior. This information can be used to offer promotions for articles the market basket analysis reveals might sell well together to other customers with similar buying habits.
Descriptive analytics can also be used to create RFM models (see Figure 3). These provide insights into historical customer trends, patterns, and behavior. It can also reveal a retailer’s best customers are as well as customers who might be ready to churn.
Figure 3: Building an RFM segmentation model in Alteryx.
Football players have even used descriptive analytics in their salary negotiations. In its Kevin de Bruyne and football’s data revolution, Analytics FC reports they were asked by Kevin De Bruyne and his team to create an analysis of every aspect of his contribution to Manchester City before contract renegotiation began. The data analysis compared De Bruyne’s output to other top talents in Europe and included both his on-field contributions and the comparative financial value of the player,” says Analytics FC.
The reports concluded De Bruyne was among the best chance creators in the Premier League. “In fact, De Bruyne’s output marked him out as the best in Europe using our bespoke Goal Difference Added (GDA) performance model, which considers the positive or negative impact made by every single touch by a player in any given match,” claims Analytics FC. In the end, the detailed analysis demonstrated De Bruyne’s true value to the team, which led to the player signing a new five-year, £104 million deal.
Although this type of information might not be as valuable as a prescriptive analytics revenue management model providing room pricing data for a near-full hotel, it does hold considerable value to a business wanting to understand its past performance.
Model Types Commonly Used for Descriptive Analytics
Descriptive analytics focuses on summarizing historical data to understand what happened and identify patterns, trends, and relationships. Unlike predictive analytics (which forecasts future outcomes) or prescriptive analytics (which recommends actions), descriptive analytics answer questions like:
1. Statistical Summarization
2. Data Aggregation & Grouping
3. Data Visualization
4. Cohort Analysis
5. Clustering
6. Association Rule Mining
7. Trend Analysis
8. Dimensionality Reduction
9. Benchmarking & Comparative Analysis
10. Text & Sentiment Summarization
Descriptive Analytics Software
• BI Tools: Domo, Qlik, Tableau, Power BI, Looker
• Spreadsheet Software: Excel, Google Sheets
• Statistical Tools: R, Python
• Database Querying: SQL, BigQuery
Diagnostic Analytics — Why Did It Happen?
The second step of the Analytic Value Escalator, diagnostic analytics, provides insight into the data. As Holmes likes to say in The Boscombe Valley Mystery, “You know my method. It is founded upon the observation of trifles,” and so it is with diagnostic analytics. In this book, Holmes digs into subtle clues, like mud on a boot, a torn letter, a dying man’s last words, to explain events that might reveal the killer. Just like diagnostic analytics drilling into a data set filled with anomalies, Holmes connects the mystery’s dots and reveals the killer.
Diagnostics analysis is all about diagnosis. It identifies the root cause of a problem. It looks at correlating data points — “Did a sales rise coincide with a national holiday? Did the sales drop results from a website outage? It tries to understand the reason behind actions. Holmes often rejects assumptions that don’t add up. He dismisses superficial theories while demanding deeper and more profound insights as it should be with diagnostic analytics.
As I explain in my article, The Fantastic Four of Analytics, “A good way to think about diagnostics is to consider a technician doing a diagnostic check on a computer. He assesses what might have gone wrong, usually using a set of steps to test the hardware and software involved. Once he discovers the problem, he follows a standard set of instructions to fix it.”
To continue the customer churn example from Figure 1, diagnostic analytics takes the data a step further by pointing to the root-cause of issues, like why a customer might churn. It enables directional guidance for faster reactions to fix problems.
Diagnostic analytics can also be used for customer behavior analysis to reveal why a customer purchases a product as well as what product features might be the tipping point for closing the sale. It can also explain why sales dropped in the previous quarter or why cart abandonment rates are so high. Results from these analytics can motivate a retailer to investigate checkout friction, shipping costs, or payment failures.
“Why is production delayed?” is a question diagnostic analytics can answer. Perhaps a machine is down, or a supply chain bottleneck is holding things up, or there’s a workforce gap. Root cause analysis, correlation analysis
or anomaly and outlier detection models can reveal where and why the problem occurred.
When IT systems are failing, trace server logs can pinpoint software bugs or cyberattacks. Cybersecurity analytics can use diagnostic analytics to understand why a data breach occurred. It can trace attack vectors as well as explain why network latency is so high or reveal questionable traffic sources.
Diagnostic analytics is particularly good for catching fraud. Questions like, “Why did expenses spike?” could reveal questionable billing. It can drill into departmental spending or suspicious vendor invoices. It identifies transaction patterns linked to scams, for example with chargeback fraud.
Hotels leverage diagnostic analytics to uncover the root causes of operational inefficiencies, guest dissatisfaction, and revenue losses. Diagnostic analytics can be used to spot recurring issues, like slow check-ins, slow Wi-FI or dirty rooms. By mining guest reviews, surveys, and social media. Using natural language processing tools to mine guest reviews (see Figure 4), hotels can detect emotional triggers in their hotel feedback.
Figure 4: Diagnostic analytics can be used for social media sentiment analysis.
“We approached the case, you remember, with an absolutely blank mind, which is always an advantage. We had formed no theories. We were simply there to observe and to draw inferences from our observations,” Sherlock Holmes said in The Adventure of the Cardboard Box. This is an effective way to think about diagnostics. Observe, draw inferences from what you see and let the data lead you where it may, while remaining open to being surprised by what it reveals.
Although diagnostic analytics have clear use cases, it’s not proactive. It’s still only step two on the Analytic Value Escalator, which means ROI returns are modest. When it comes to diagnostic analytics, Holmes put it best (when he discussed hypothesis testing in The Sign of Four), “When you have eliminated the impossible, whatever remains, however improbable, must be the truth.” The true value of analytics comes in the next two types up the Escalator — predictive and prescriptive analytics.
Model Types Commonly Used for Diagnostic Analytics
Diagnostic aims to discover why something happened. It involves deeper investigation into data patterns, correlations, and root causes.
The key modeling techniques include:
1. Root Cause Analysis
2. Correlation Analysis
3. Regression Analysis
4. Anomaly & Outlier Detection
5. Time Series Decomposition
6. Hypothesis Testing
7. Process Mining
8. Network Analysis
9. Text & Sentiment Diagnostics
10. Sentiment Trend Analysis
Diagnostic Analytics Software
• Statistical Software: R, Python
• BI Tools: Domo, Qlik, Power BI, Tableau
• SQL
• Process Mining Tools: Celonis, Disco
Predictive Analytics — What Could Happen?
This third step in Gartner’s Analytics Value Escalator, predictive analytics, uses data, statistical algorithms, and ML to forecast future trends. This is where the real value of analytics emerges. It is a powerful tool that leverages historical data, statistical algorithms, and machine learning to forecast future outcomes, trends, and behaviors.
In his article Predictive Analytics White Paper, Charles Nyce, a recognized expert in the fields of risk management, insurance, and financial regulation states, “Predictive analytics is a broad term describing a variety of statistical and analytical techniques used to develop models that predict future events or behaviors. The form of these predictive models varies, depending on the behavior or event that they are predicting. Most predictive models generate a score (a patron rating, for example), with a higher score indicating a higher likelihood of the given behavior or event occurring.”
Sherlock Holmes would agree. “You can, for example, never foretell what any one man will do, but you can say with precision what an average number will be up to. Individuals vary, but percentages remain constant,” he said in The Sign of Four. This statement perfectly embodies the essence of what predictive analytics can do. Holmes acknowledges uncertainty in individual cases but puts his full faith in aggregate patterns. His “percentages” mirror ML models that predict outcomes based on historical trends. While Holmes uses probabilities to anticipate crimes, businesses can use predictive analytics to preempt risks.
Predictive analytics can help marketers increase their hit rates by selecting only the candidates most likely to use an offer from a large dataset of customers. By utilizing data from past campaigns and measures generated by a predictive marketing model, actual campaign response rates can be tracked against expected campaign response rates.
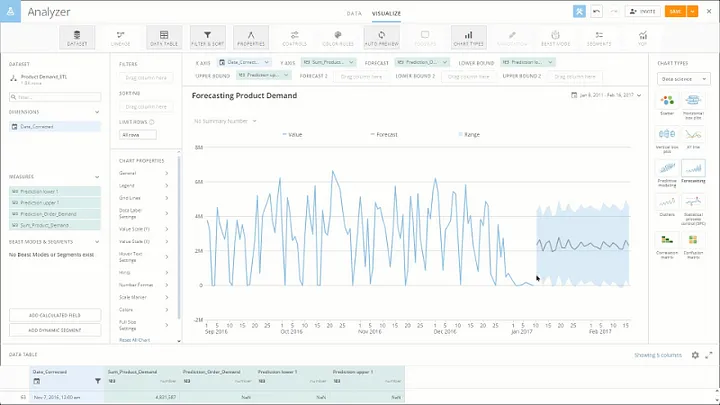
Figure 5: A product demand forecasting model built in Domo.
Airlines use predictive models to dynamically price their seats. Hotels do the same for their rooms. Casinos use it to price minimum hands on their baccarat tables, ensuring higher profits at busier times. In the insurance industry, predictive models help with pricing, product optimization and claims processing automation. Healthcare providers use predictive analytics to identify patients who are at risk of developing life-threatening diseases. It helps with personalized treatment plans as well.
Customer Churn Models
As per figure 1, predictive analytics “Uses algorithms to retain a customer who might churn; changing a Telco plan or making an offer so tempting the customer just can’t refuse it.” Looking at past customer behavior, customer churn models can uncover predictors and behaviors that provide clues as to why someone might switch to a competitor.
Once this behavior is recognized, the telco company can proactively market to the customers with offers that take into account their unhappiness with the company’s products and/or services. For example, a telco customer who continuously gets hit with overage charges can be offered a higher minute's plan that might be more expensive per month but actually be cheaper in the long run because consistent overages jack up the bill. This kind of proactive and personalized customer service can make the customer realize the telco is looking out for them rather than just looking to continuously charge them for overages month after month.
Figure 6: Using Alteryx to generate a customer churn predicted value (score). Image created by author.
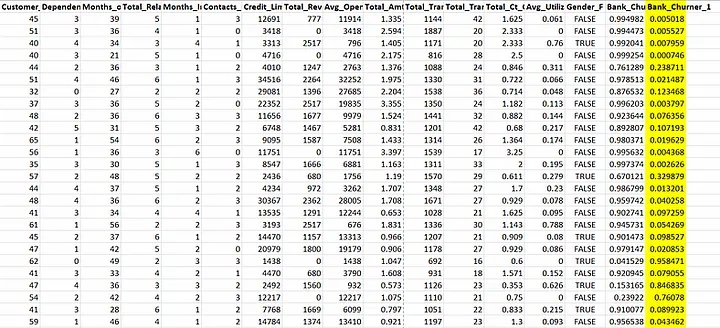
Figure 7: Excel chart revealing the churn scores. Image created by Author.
Model Types Commonly Used for Predictive Analytics
Predictive analytics encompasses a wide variety of analytical modeling techniques that use historical and current data to forecast future outcomes. Key types include:
1. Regression Models
2. Time Series Forecasting Models
3. Machine Learning Models
4. Classification Models
5. Ensemble Methods
6. Survival Analysis
7. Clustering for Predictive Insights
8. Text Analytics & NLP Models
9. Anomaly Detection Models
Predictive Analytics Software
• Open source: Python and R
• Big data: Use Spark MLlib or Google BigQuery ML
• Enterprises: SAS, IBM SPSS, Alteryx, Denodo or DataRobot
• Deep learning: TensorFlow/PyTorch
Prescriptive Analytics — What Should Happen?
The fourth and final step of the Analytic Value Escalator is prescriptive analytics, which provides amplified intelligence and automation. It tries to take the results of a predictive analytics model and asks, “How can we make it happen again?” It tries to reveal how a particular analytical result came about and, just as importantly, how it can be replicated.
In its Prescriptive Analytics Makes Waves with Retail & CPG, Profitect states prescriptive analytics is the “application of logic and mathematics to data to specify a preferred course of action. The most common examples are optimization methods, such as linear programming; decision analysis methods, such as influence diagrams; and predictive analytics working in combination with rules.” Prescriptive analytics is unique because its output is a decision, concludes Profitect.
Prescriptive analytics attempt to anticipate not only what will happen, but also when it will happen and why it is happening. It provides a forward-looking approach and recommends specific actions. For example, a prescriptive analytics model might recommend lowering the price of winter coats by 15% in March to clear inventory, while increasing the price of swimwear by 10% ahead of summer demand. A customer who abandoned their cart would be sent a 10% discount code within 1 hour, which might increase conversion by 20%.
Logistics companies use prescriptive analytics to dynamically route their vehicles. For example, UPS uses prescriptive models to adjust delivery routes in real-time, reducing fuel costs and delays.
Walmart stochastic optimization and machine learning to prescribe optimal stock levels for each store based on demand forecasts, weather, and promotions.
Healthcare companies offer personalized treatment plans for cancer patients. Hospitals use it for staff scheduling. Prescriptive models allocate nurses and doctors based on predicted patient admissions based on patient demand, staff availability, and skill requirements. Patient outcomes can even be improved with prescriptive analytics as they can evaluate the cost-effectiveness of treatments while identifying high-risk patients who might need preventive interventions.
In the finance sector, banks like JPMorgan Chase use prescriptive analytics to block suspicious transactions and suggest alternative payment methods. Hedge funds prescribe asset allocations to maximize returns while minimizing risk.
Retailers use dynamic pricing to adjust prices in real-time based on demand, competition, and inventory. They might also offer personalized promotions on items customers are likely to buy next. Retailers might also use prescriptive analytics to decide where to open a new store (see Figure 8).
Figure 8: Geospatial data used by a retailer to decide where to open a new store.
Prescriptive analytics even go down to street level, literally. In smart cities around the US, emergency response planning utilizes this type of modeling. Prescriptive models guide fire departments on station locations and resource allocation. The City of Los Angeles even uses it to reduce congestion by adjusting signal timings dynamically. In a city so filled with traffic jams, this must be a welcome relief to drivers spending hours a day on their commutes.
Model Types Commonly Used for Prescriptive Analytics
Prescriptive analytics goes beyond the other three types of analytics to recommend optimal actions — answering “What should we do?” It combines optimization, simulation, and decision science to guide data-driven decision-making. As Holmes would say, data becomes a blueprint for action.
Key modeling techniques include:
• Optimization Models
• Decision Analysis Models
• Simulation Models
• Machine Learning and Optimization
• Game Theory Models
• Markov Decision Processes (MDPs)
Predictive Analytics Software
• Optimization: Gurobi, CPLEX, PuLP (Python), Excel Solver
• Simulation: AnyLogic, Simul8, Arena
• Decision AI: IBM Decision Optimization, Google OR-Tools
• Reinforcement Learning: OpenAI Gym, TensorFlow Agents
Turning Data Into Information, and Information into Insight
“The goal is to turn data into information, and information into insight,” said Carly Fiorina, former CEO of Hewlett-Packard. Ultimately, this is what analytics is all about — gaining insight into one’s data. Descriptive, diagnostic, predictive, and prescriptive analytics allow companies to look into their databases, gain insight, and make data-driven business decisions fully taking into account this data.
Descriptive analytics clearly reveal what has happened in the past. Diagnostics analytics makes sense of it. Predictive and prescriptive analytics are similar, but the former asks the question “What could happen?” while the latter wants to know how to make it happen again. Prescriptive analytics outputs a decision, unlike the other three. An action is prescribed so an expected result is attained. This is the most important type of analytics as it is where the greatest return on investment will be.
One thing to remember about working with data — it’s best to remain humble. I don’t fully subscribe to Mark Twain’s statement (via Benjamin Disraeli) that “There are three kinds of lies; lies, damned lies, and statistics”, but one should respect the analytics process as well as the underlying data being processed inside these models. This will ensure results are as accurate as possible and embarrassing findings aren’t shared far and wide.
“Ignorance more frequently begets confidence than does knowledge,” said Charles Darwin in The Descent of Man. It’s a good cautionary warning against flawed deductive reasoning that analysts would be wise to keep in mind when working with analytics.
“The world is full of obvious things which nobody by any chance ever observes,” Sherlock Holmes said in The Hound of the Baskervilles. Holmes’ famously caught important details everyone else overlooked, which allowed him to solve some of his most famous cases. He’d be a big fan of Gartner’s four types of analytics, which can identify hidden patterns in data as well as prescribe actions based on insights that are not immediately apparent to all.
“Mathematics is the language in which God has written the universe,” said Galileo Galilei, the great Italian astronomer, physicist and engineer. If that’s so, perhaps one of its most important disciplines, analytics, can help us makes sense of this gloriously mysterious world as well as make a Sherlock Holmes of each and every one of us.
The Analytics Value Escalator illustrates how analytics maturity evolves from descriptive (what happened?) to diagnostic (why did it happen?) to predictive (what will happen?) to prescriptive (what should happen?). The business value increases as you rise up the four analytics steps, but so too does the difficulty level. With analytics investments, optimization is the ultimate goal as that’s where the biggest ROI will come from. The Analytics Value Escalator is a part of Gartner’s broader push to frame analytics maturity in terms of business outcomes.
Real-time, data-driven analytical insights are improving corporate decision-making capabilities. With analytics, corporations can understand their business down to a widget sale level. They can identify areas to improve efficiency and reduce costs, thereby, potentially, increasing profit.
Personalization marketing, which needs strong analytics to function properly, helps raise customer satisfaction scores. Customer feedback loops, which use real-time data from social media channels, provide businesses with instant information on how to improve their products and services. Revenue management models even help airlines, casinos, amusement parks, and hospitality companies sell perishable inventory at the highest possible price.
The Four Types of Analytics
Descriptive analytics, diagnostic analytics, predictive analytics, and prescriptive analytics all have some similarities (besides having ‘analytics’ in their name), but they are all quite unique too. One type of analytics builds upon another, gaining value in the rise up the Analytics Value Escalator.
As organizations move up the escalator, the value of the analytics increases, but so does the difficulty of getting a positive ROI result. With analytics, there are no free steps.
Descriptive analytics, the lowest rung of the Escalator, it the easiest to attain but has limited value. Prescriptive analytics is the hardest to implement, but it provides the most value to an organization. Optimization is the goal for most corporations and companies who implement prescriptive analytics well can see healthy ROI returns. This is the rarified air of revenue price optimization, dynamic pricing, personalized promotions, fraud response automation, and full labor utilization models.
Descriptive Analytics — What Happened?
“Data! Data! Data! I can’t make bricks without clay,” Sherlock Holmes cried in The Adventure of the Copper Beeches. Holmes was a man who understood the need for analytics, particularly descriptive analytics, which focuses on facts and is the foundational element upon which more powerful analytics can be built.
Unlike predictive analytics or prescriptive analytics, descriptive analytics answer questions like:
• What were our sales last quarter?
• How does customer behavior vary by region?
• What are the most common reasons for customer churn?
• Who are the company’s highest spenders?
Descriptive analytics are the basis for reports and dashboards that look back and provide hindsight about a company’s data and business, like sales performance for the past quarter. Many business intelligence (BI) dashboards provide nothing more than a set of descriptive analytics that provide insightful information about company’s past behavior, often with graphs, charts, tables or maps.
Segmentation models (See Figure 1) are considered a descriptive analytics model. They help businesses track all kinds of unique features about their customers, including age, gender, demographics, location, education level, income, etc., etc., etc. These segments let businesses personalize their marketing offers, making them more enticing.
Figure 2: A business intelligence dashboard showing customer segments.
Descriptive analytics analyze historical data to identify patterns, trends, and relationships. It summarizes data, describes the main features of a dataset, identifies trends and correlations between variables over time. It includes measurements like the mean, range, standard deviation, and distribution. It provides insight into an organization’s past performances while offering context to help corporate executives and stakeholders interpret the data.
Retailers can use descriptive analytics for market basket analysis, which can reveal a customer’s shopping and purchasing behavior. This information can be used to offer promotions for articles the market basket analysis reveals might sell well together to other customers with similar buying habits.
Descriptive analytics can also be used to create RFM models (see Figure 3). These provide insights into historical customer trends, patterns, and behavior. It can also reveal a retailer’s best customers are as well as customers who might be ready to churn.
Figure 3: Building an RFM segmentation model in Alteryx.
Football players have even used descriptive analytics in their salary negotiations. In its Kevin de Bruyne and football’s data revolution, Analytics FC reports they were asked by Kevin De Bruyne and his team to create an analysis of every aspect of his contribution to Manchester City before contract renegotiation began. The data analysis compared De Bruyne’s output to other top talents in Europe and included both his on-field contributions and the comparative financial value of the player,” says Analytics FC.
The reports concluded De Bruyne was among the best chance creators in the Premier League. “In fact, De Bruyne’s output marked him out as the best in Europe using our bespoke Goal Difference Added (GDA) performance model, which considers the positive or negative impact made by every single touch by a player in any given match,” claims Analytics FC. In the end, the detailed analysis demonstrated De Bruyne’s true value to the team, which led to the player signing a new five-year, £104 million deal.
Although this type of information might not be as valuable as a prescriptive analytics revenue management model providing room pricing data for a near-full hotel, it does hold considerable value to a business wanting to understand its past performance.
Model Types Commonly Used for Descriptive Analytics
Descriptive analytics focuses on summarizing historical data to understand what happened and identify patterns, trends, and relationships. Unlike predictive analytics (which forecasts future outcomes) or prescriptive analytics (which recommends actions), descriptive analytics answer questions like:
1. Statistical Summarization
2. Data Aggregation & Grouping
3. Data Visualization
4. Cohort Analysis
5. Clustering
6. Association Rule Mining
7. Trend Analysis
8. Dimensionality Reduction
9. Benchmarking & Comparative Analysis
10. Text & Sentiment Summarization
Descriptive Analytics Software
• BI Tools: Domo, Qlik, Tableau, Power BI, Looker
• Spreadsheet Software: Excel, Google Sheets
• Statistical Tools: R, Python
• Database Querying: SQL, BigQuery
Diagnostic Analytics — Why Did It Happen?
The second step of the Analytic Value Escalator, diagnostic analytics, provides insight into the data. As Holmes likes to say in The Boscombe Valley Mystery, “You know my method. It is founded upon the observation of trifles,” and so it is with diagnostic analytics. In this book, Holmes digs into subtle clues, like mud on a boot, a torn letter, a dying man’s last words, to explain events that might reveal the killer. Just like diagnostic analytics drilling into a data set filled with anomalies, Holmes connects the mystery’s dots and reveals the killer.
Diagnostics analysis is all about diagnosis. It identifies the root cause of a problem. It looks at correlating data points — “Did a sales rise coincide with a national holiday? Did the sales drop results from a website outage? It tries to understand the reason behind actions. Holmes often rejects assumptions that don’t add up. He dismisses superficial theories while demanding deeper and more profound insights as it should be with diagnostic analytics.
As I explain in my article, The Fantastic Four of Analytics, “A good way to think about diagnostics is to consider a technician doing a diagnostic check on a computer. He assesses what might have gone wrong, usually using a set of steps to test the hardware and software involved. Once he discovers the problem, he follows a standard set of instructions to fix it.”
To continue the customer churn example from Figure 1, diagnostic analytics takes the data a step further by pointing to the root-cause of issues, like why a customer might churn. It enables directional guidance for faster reactions to fix problems.
Diagnostic analytics can also be used for customer behavior analysis to reveal why a customer purchases a product as well as what product features might be the tipping point for closing the sale. It can also explain why sales dropped in the previous quarter or why cart abandonment rates are so high. Results from these analytics can motivate a retailer to investigate checkout friction, shipping costs, or payment failures.
“Why is production delayed?” is a question diagnostic analytics can answer. Perhaps a machine is down, or a supply chain bottleneck is holding things up, or there’s a workforce gap. Root cause analysis, correlation analysis
or anomaly and outlier detection models can reveal where and why the problem occurred.
When IT systems are failing, trace server logs can pinpoint software bugs or cyberattacks. Cybersecurity analytics can use diagnostic analytics to understand why a data breach occurred. It can trace attack vectors as well as explain why network latency is so high or reveal questionable traffic sources.
Diagnostic analytics is particularly good for catching fraud. Questions like, “Why did expenses spike?” could reveal questionable billing. It can drill into departmental spending or suspicious vendor invoices. It identifies transaction patterns linked to scams, for example with chargeback fraud.
Hotels leverage diagnostic analytics to uncover the root causes of operational inefficiencies, guest dissatisfaction, and revenue losses. Diagnostic analytics can be used to spot recurring issues, like slow check-ins, slow Wi-FI or dirty rooms. By mining guest reviews, surveys, and social media. Using natural language processing tools to mine guest reviews (see Figure 4), hotels can detect emotional triggers in their hotel feedback.
Figure 4: Diagnostic analytics can be used for social media sentiment analysis.
“We approached the case, you remember, with an absolutely blank mind, which is always an advantage. We had formed no theories. We were simply there to observe and to draw inferences from our observations,” Sherlock Holmes said in The Adventure of the Cardboard Box. This is an effective way to think about diagnostics. Observe, draw inferences from what you see and let the data lead you where it may, while remaining open to being surprised by what it reveals.
Although diagnostic analytics have clear use cases, it’s not proactive. It’s still only step two on the Analytic Value Escalator, which means ROI returns are modest. When it comes to diagnostic analytics, Holmes put it best (when he discussed hypothesis testing in The Sign of Four), “When you have eliminated the impossible, whatever remains, however improbable, must be the truth.” The true value of analytics comes in the next two types up the Escalator — predictive and prescriptive analytics.
Model Types Commonly Used for Diagnostic Analytics
Diagnostic aims to discover why something happened. It involves deeper investigation into data patterns, correlations, and root causes.
The key modeling techniques include:
1. Root Cause Analysis
2. Correlation Analysis
3. Regression Analysis
4. Anomaly & Outlier Detection
5. Time Series Decomposition
6. Hypothesis Testing
7. Process Mining
8. Network Analysis
9. Text & Sentiment Diagnostics
10. Sentiment Trend Analysis
Diagnostic Analytics Software
• Statistical Software: R, Python
• BI Tools: Domo, Qlik, Power BI, Tableau
• SQL
• Process Mining Tools: Celonis, Disco
Predictive Analytics — What Could Happen?
This third step in Gartner’s Analytics Value Escalator, predictive analytics, uses data, statistical algorithms, and ML to forecast future trends. This is where the real value of analytics emerges. It is a powerful tool that leverages historical data, statistical algorithms, and machine learning to forecast future outcomes, trends, and behaviors.
In his article Predictive Analytics White Paper, Charles Nyce, a recognized expert in the fields of risk management, insurance, and financial regulation states, “Predictive analytics is a broad term describing a variety of statistical and analytical techniques used to develop models that predict future events or behaviors. The form of these predictive models varies, depending on the behavior or event that they are predicting. Most predictive models generate a score (a patron rating, for example), with a higher score indicating a higher likelihood of the given behavior or event occurring.”
Sherlock Holmes would agree. “You can, for example, never foretell what any one man will do, but you can say with precision what an average number will be up to. Individuals vary, but percentages remain constant,” he said in The Sign of Four. This statement perfectly embodies the essence of what predictive analytics can do. Holmes acknowledges uncertainty in individual cases but puts his full faith in aggregate patterns. His “percentages” mirror ML models that predict outcomes based on historical trends. While Holmes uses probabilities to anticipate crimes, businesses can use predictive analytics to preempt risks.
Predictive analytics can help marketers increase their hit rates by selecting only the candidates most likely to use an offer from a large dataset of customers. By utilizing data from past campaigns and measures generated by a predictive marketing model, actual campaign response rates can be tracked against expected campaign response rates.
Figure 5: A product demand forecasting model built in Domo.
Airlines use predictive models to dynamically price their seats. Hotels do the same for their rooms. Casinos use it to price minimum hands on their baccarat tables, ensuring higher profits at busier times. In the insurance industry, predictive models help with pricing, product optimization and claims processing automation. Healthcare providers use predictive analytics to identify patients who are at risk of developing life-threatening diseases. It helps with personalized treatment plans as well.
Customer Churn Models
As per figure 1, predictive analytics “Uses algorithms to retain a customer who might churn; changing a Telco plan or making an offer so tempting the customer just can’t refuse it.” Looking at past customer behavior, customer churn models can uncover predictors and behaviors that provide clues as to why someone might switch to a competitor.
Once this behavior is recognized, the telco company can proactively market to the customers with offers that take into account their unhappiness with the company’s products and/or services. For example, a telco customer who continuously gets hit with overage charges can be offered a higher minute's plan that might be more expensive per month but actually be cheaper in the long run because consistent overages jack up the bill. This kind of proactive and personalized customer service can make the customer realize the telco is looking out for them rather than just looking to continuously charge them for overages month after month.
Figure 6: Using Alteryx to generate a customer churn predicted value (score). Image created by author.
Figure 7: Excel chart revealing the churn scores. Image created by Author.
Model Types Commonly Used for Predictive Analytics
Predictive analytics encompasses a wide variety of analytical modeling techniques that use historical and current data to forecast future outcomes. Key types include:
1. Regression Models
2. Time Series Forecasting Models
3. Machine Learning Models
4. Classification Models
5. Ensemble Methods
6. Survival Analysis
7. Clustering for Predictive Insights
8. Text Analytics & NLP Models
9. Anomaly Detection Models
Predictive Analytics Software
• Open source: Python and R
• Big data: Use Spark MLlib or Google BigQuery ML
• Enterprises: SAS, IBM SPSS, Alteryx, Denodo or DataRobot
• Deep learning: TensorFlow/PyTorch
Prescriptive Analytics — What Should Happen?
The fourth and final step of the Analytic Value Escalator is prescriptive analytics, which provides amplified intelligence and automation. It tries to take the results of a predictive analytics model and asks, “How can we make it happen again?” It tries to reveal how a particular analytical result came about and, just as importantly, how it can be replicated.
In its Prescriptive Analytics Makes Waves with Retail & CPG, Profitect states prescriptive analytics is the “application of logic and mathematics to data to specify a preferred course of action. The most common examples are optimization methods, such as linear programming; decision analysis methods, such as influence diagrams; and predictive analytics working in combination with rules.” Prescriptive analytics is unique because its output is a decision, concludes Profitect.
Prescriptive analytics attempt to anticipate not only what will happen, but also when it will happen and why it is happening. It provides a forward-looking approach and recommends specific actions. For example, a prescriptive analytics model might recommend lowering the price of winter coats by 15% in March to clear inventory, while increasing the price of swimwear by 10% ahead of summer demand. A customer who abandoned their cart would be sent a 10% discount code within 1 hour, which might increase conversion by 20%.
Logistics companies use prescriptive analytics to dynamically route their vehicles. For example, UPS uses prescriptive models to adjust delivery routes in real-time, reducing fuel costs and delays.
Walmart stochastic optimization and machine learning to prescribe optimal stock levels for each store based on demand forecasts, weather, and promotions.
Healthcare companies offer personalized treatment plans for cancer patients. Hospitals use it for staff scheduling. Prescriptive models allocate nurses and doctors based on predicted patient admissions based on patient demand, staff availability, and skill requirements. Patient outcomes can even be improved with prescriptive analytics as they can evaluate the cost-effectiveness of treatments while identifying high-risk patients who might need preventive interventions.
In the finance sector, banks like JPMorgan Chase use prescriptive analytics to block suspicious transactions and suggest alternative payment methods. Hedge funds prescribe asset allocations to maximize returns while minimizing risk.
Retailers use dynamic pricing to adjust prices in real-time based on demand, competition, and inventory. They might also offer personalized promotions on items customers are likely to buy next. Retailers might also use prescriptive analytics to decide where to open a new store (see Figure 8).
Figure 8: Geospatial data used by a retailer to decide where to open a new store.
Prescriptive analytics even go down to street level, literally. In smart cities around the US, emergency response planning utilizes this type of modeling. Prescriptive models guide fire departments on station locations and resource allocation. The City of Los Angeles even uses it to reduce congestion by adjusting signal timings dynamically. In a city so filled with traffic jams, this must be a welcome relief to drivers spending hours a day on their commutes.
Model Types Commonly Used for Prescriptive Analytics
Prescriptive analytics goes beyond the other three types of analytics to recommend optimal actions — answering “What should we do?” It combines optimization, simulation, and decision science to guide data-driven decision-making. As Holmes would say, data becomes a blueprint for action.
Key modeling techniques include:
• Optimization Models
• Decision Analysis Models
• Simulation Models
• Machine Learning and Optimization
• Game Theory Models
• Markov Decision Processes (MDPs)
Predictive Analytics Software
• Optimization: Gurobi, CPLEX, PuLP (Python), Excel Solver
• Simulation: AnyLogic, Simul8, Arena
• Decision AI: IBM Decision Optimization, Google OR-Tools
• Reinforcement Learning: OpenAI Gym, TensorFlow Agents
Turning Data Into Information, and Information into Insight
“The goal is to turn data into information, and information into insight,” said Carly Fiorina, former CEO of Hewlett-Packard. Ultimately, this is what analytics is all about — gaining insight into one’s data. Descriptive, diagnostic, predictive, and prescriptive analytics allow companies to look into their databases, gain insight, and make data-driven business decisions fully taking into account this data.
Descriptive analytics clearly reveal what has happened in the past. Diagnostics analytics makes sense of it. Predictive and prescriptive analytics are similar, but the former asks the question “What could happen?” while the latter wants to know how to make it happen again. Prescriptive analytics outputs a decision, unlike the other three. An action is prescribed so an expected result is attained. This is the most important type of analytics as it is where the greatest return on investment will be.
One thing to remember about working with data — it’s best to remain humble. I don’t fully subscribe to Mark Twain’s statement (via Benjamin Disraeli) that “There are three kinds of lies; lies, damned lies, and statistics”, but one should respect the analytics process as well as the underlying data being processed inside these models. This will ensure results are as accurate as possible and embarrassing findings aren’t shared far and wide.
“Ignorance more frequently begets confidence than does knowledge,” said Charles Darwin in The Descent of Man. It’s a good cautionary warning against flawed deductive reasoning that analysts would be wise to keep in mind when working with analytics.
“The world is full of obvious things which nobody by any chance ever observes,” Sherlock Holmes said in The Hound of the Baskervilles. Holmes’ famously caught important details everyone else overlooked, which allowed him to solve some of his most famous cases. He’d be a big fan of Gartner’s four types of analytics, which can identify hidden patterns in data as well as prescribe actions based on insights that are not immediately apparent to all.
“Mathematics is the language in which God has written the universe,” said Galileo Galilei, the great Italian astronomer, physicist and engineer. If that’s so, perhaps one of its most important disciplines, analytics, can help us makes sense of this gloriously mysterious world as well as make a Sherlock Holmes of each and every one of us.


