How Tableau Helps Oil & Gas Companies
By leveraging Tableau, oil and gas companies can enhance their operational efficiency, improve safety and compliance, and make informed, data-driven decisions. The ability to visualize complex datasets effectively is crucial for navigating the challenges of the oil and gas industry and driving innovation.
Operational Performance Monitoring
Tableau enables energy companies to visualize real-time data from drilling operations, production metrics, and equipment performance, allowing for timely decision-making and issue identification. Dashboards can track key performance indicators (KPIs) such as production rates, operational costs, and safety incidents to ensure optimal performance.
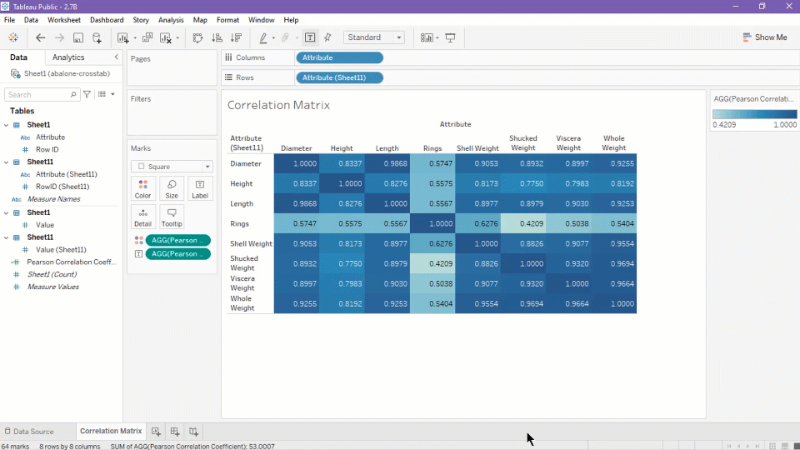
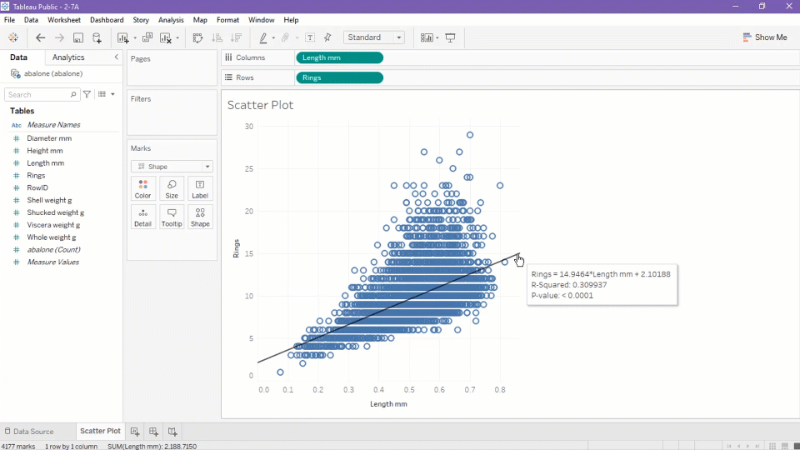
Exploration and Production Analysis
Tableau can visualize geological and geospatial data, helping geologists and engineers analyze potential drilling sites and assess resource availability. By analyzing historical production data, companies can forecast future production and optimize extraction strategies.
Financial Performance Tracking
Tableau helps visualize financial data, enabling companies to analyze revenue streams, operational costs, and profitability across different projects and divisions. The platform supports financial forecasting and budgeting processes, allowing for data-driven financial planning.
Health, Safety & Environmental Compliance
Tableau can help visualize safety data and incident reports, enabling better tracking of safety performance and compliance with regulations. Visualizing compliance data can streamline reporting processes and ensure adherence to industry regulations.
Supply Chain & Logistics Optimization
Energy companies can analyze logistics and supply chain data to optimize the transportation of materials and equipment, reducing costs and improving efficiency. Tableau helps visualize inventory levels and usage patterns, assisting in better resource allocation and management.
Data Integration
Tableau integrates data from various sources, including geological surveys, drilling logs, and financial systems, providing a comprehensive view of operations. The platform allows users to create interactive dashboards that present complex data in an accessible format, facilitating better understanding and analysis.
Automated Reporting
With Tableau, energy companies can automate their reporting processes, ensuring that stakeholders receive timely updates without manual intervention. Automated alerts can notify management of critical changes or anomalies in performance metrics, enabling swift action when necessary.
Collaboration Across Teams
Tableau facilitates collaboration among different departments by providing a shared platform for accessing and visualizing data. This collaborative approach ensures that all teams—from marketing to operations—are aligned on key metrics and objectives.
Predictive Maintenance
By leveraging data analytics, Tableau can assist energy companies in implementing predictive maintenance strategies for their fleets. Analyzing historical maintenance data helps identify patterns that predict potential failures or required maintenance actions before they impact operations.

HOW WE HELP
Our Tableau consulting services are tailored to empower businesses by integrating advanced Tableau solutions into their operations. We specialize in providing end-to-end support, from strategic development to implementation and ongoing optimization. Our key offerings include:
We begin by meeting with stakeholders from various departments—such as business, marketing, and data teams—to define the objectives of the dashboard. This step is crucial for understanding the specific metrics and insights that stakeholders need to make informed decisions.